Wait, but why?
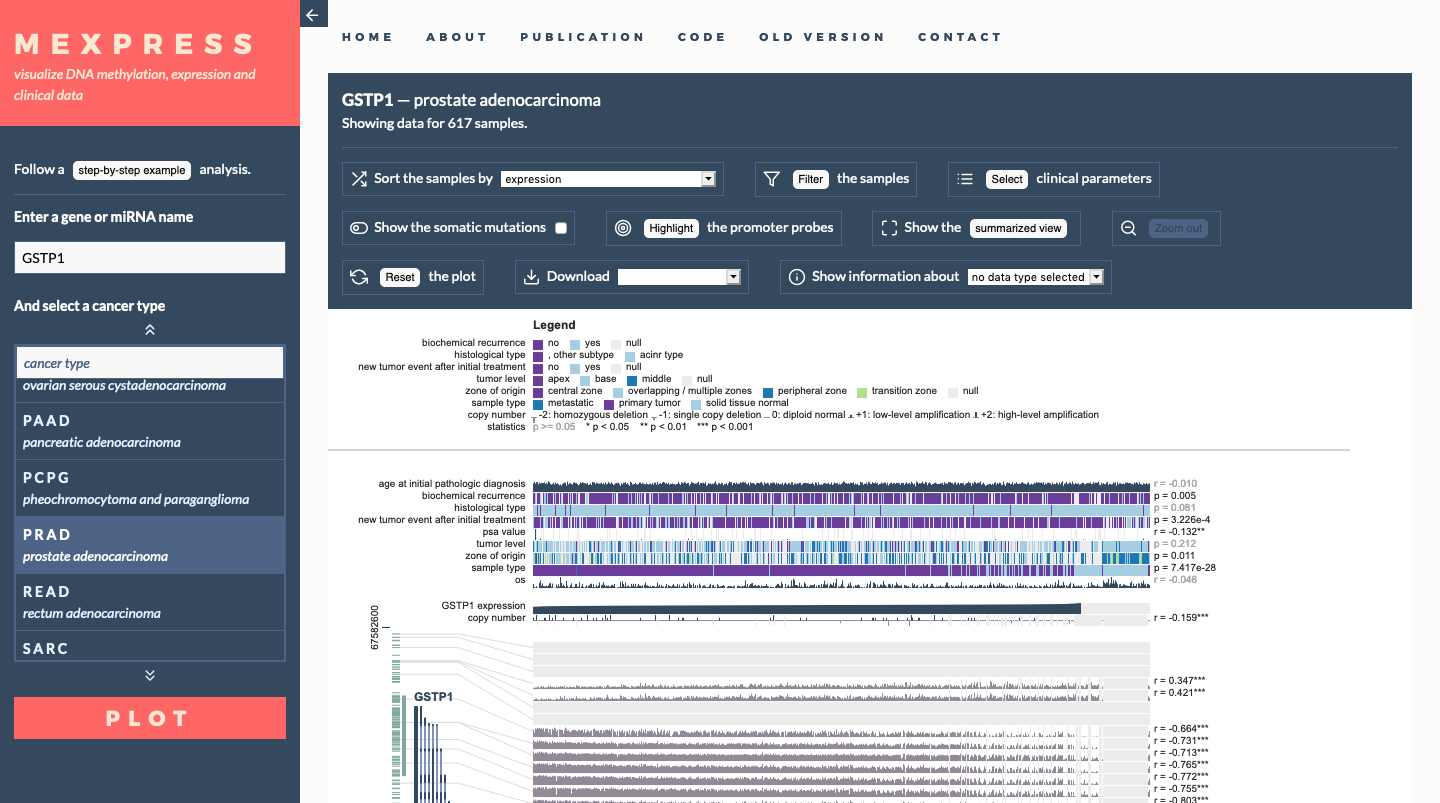
I came up with the idea to create MEXPRESS while working on my PhD thesis in bioinformatics and cancer research at the university of Ghent (read my paper here or the original version here). More and more resources are poured into the creation of publically available large-scale cancer genomics databases. Visualizing and analyzing these valuable data is unfortunately not as easy as it should be, which is why I built MEXPRESS.
The creation of huge public data repositories has a tremendous impact on cancer research. Many different research groups have created feature-rich software to access, analyze and visualize these data. What I felt was lacking though, was a very simple and straightforward tool. A tool that would allow researcher to get an overview of the data they are interested in within seconds. One page, one text input box, one selection list and a single button, it doesn't get much simpler than this.

Data-Driven Documents
I had been thinking about creating interactive plots for a while and MEXPRESS gave me the opportunity to dive right in. After a bit of tinkering with libraries that generate plots in the browser, I decided on the d3.js library created by Mike Bostock and I have to say it has been an absolute joy to work with.